How can we use data to create art, make statements, and spark change? Inspired by the work of several data artists, create your own piece of data art.
maker playground
data art | 3rd grade+
explore
What is data really? Data is information that has been organized to be easy to use and understand. We often see data represented visually in charts or graphs. Learn more about how to make a bar graph in this video.
Data artists take this one step further, taking data and showcasing it in beautiful, interesting, or unique ways. These artists use data to make important statements or spark reflection in their audience.
W.E.B. Du Bois, a sociologist, historian, and activist, is one of the founders of data art. He presented a groundbreaking exhibit, The Exhibit of American Negroes, at the 1900 Paris Exhibition. His work included data visualizations of the daily life of African Americans in the U.S. South. See W.E.B. Du Bois’s data art here.
Chris Jordan created Running the Numbers: an American Self-Portrait, a group of art pieces that represent daily American life through visual data. He explores waste, greed, and environmental destruction through his pieces. Explore more here.
What can data and art tell us about the largest city in America?

imagine
These inspiring data artists combine information and art to create masterpieces that are beautiful, interesting, and informative. Inspired by their work, create your own piece of data art.
- What data set will you base your art on? Will you make a piece of art from data you already have, or do you need to gather information first?
- How will you show your data in an interesting and beautiful way? What artistic elements like color, shape, and size will you use to communicate about your data?
- What message will you send with your data art? Will your art make a statement about the world or make your audience want to change? How will you use art and data to make your point?
Need more inspiration? Explore Information is Beautiful, a website devoted to identifying unexpected patterns and connections, and then illustrating them in beautiful and creative ways.
create
After you’ve sketched out your ideas, it’s time to create your masterpiece! Use any materials, programs, or apps you have around you. Be creative and experiment!
If you’re feeling stuck, check out the ideas in our slideshow!
Send your finished data art to KID museum and be part of our data gallery! Send files or pictures to socialmedia@kid-museum.org.
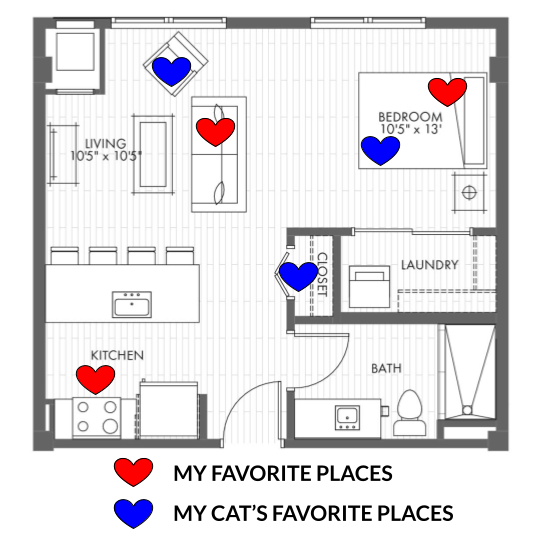
Use color to highlight differences between people or groups.

Showcase your data in a unique chart or graph.

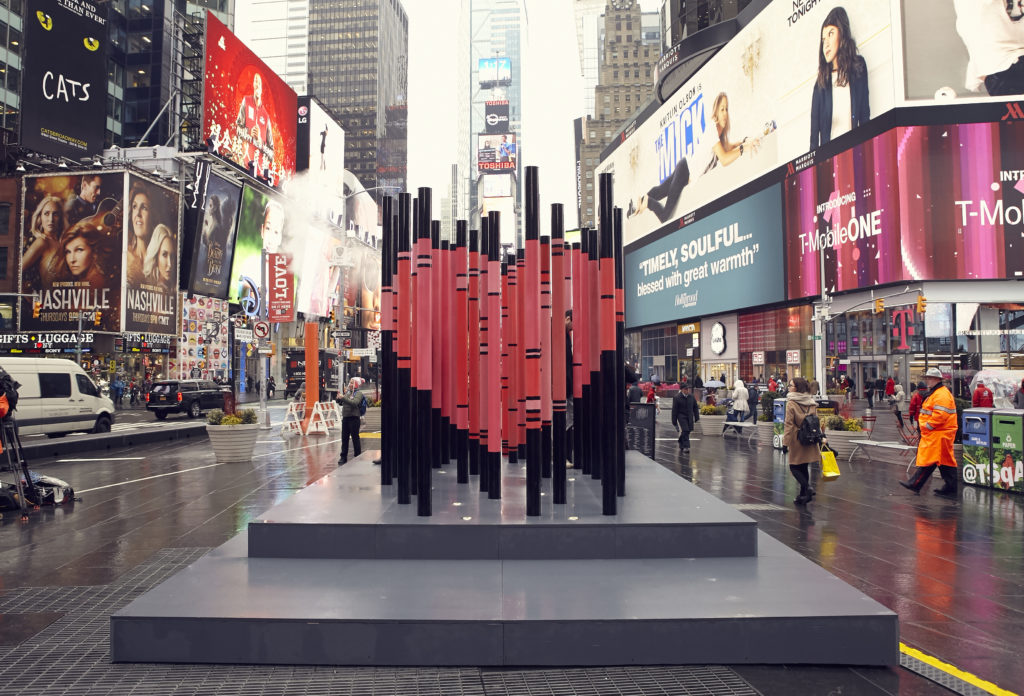
Represent your data with a 3D sculpture like Jer Thorpe’s sculpture, We Were Strangers Once Too. Learn more about it in the Explore video.